- ClientNFCAC
- Year2025
- RoleUI/UX Designer
- CategoryDashboard Design
The challenge
Order management is a pipeline, but most interfaces present it as separate lists. Staff had to check three screens to answer one question: where is everything, and what is stuck.
What I did
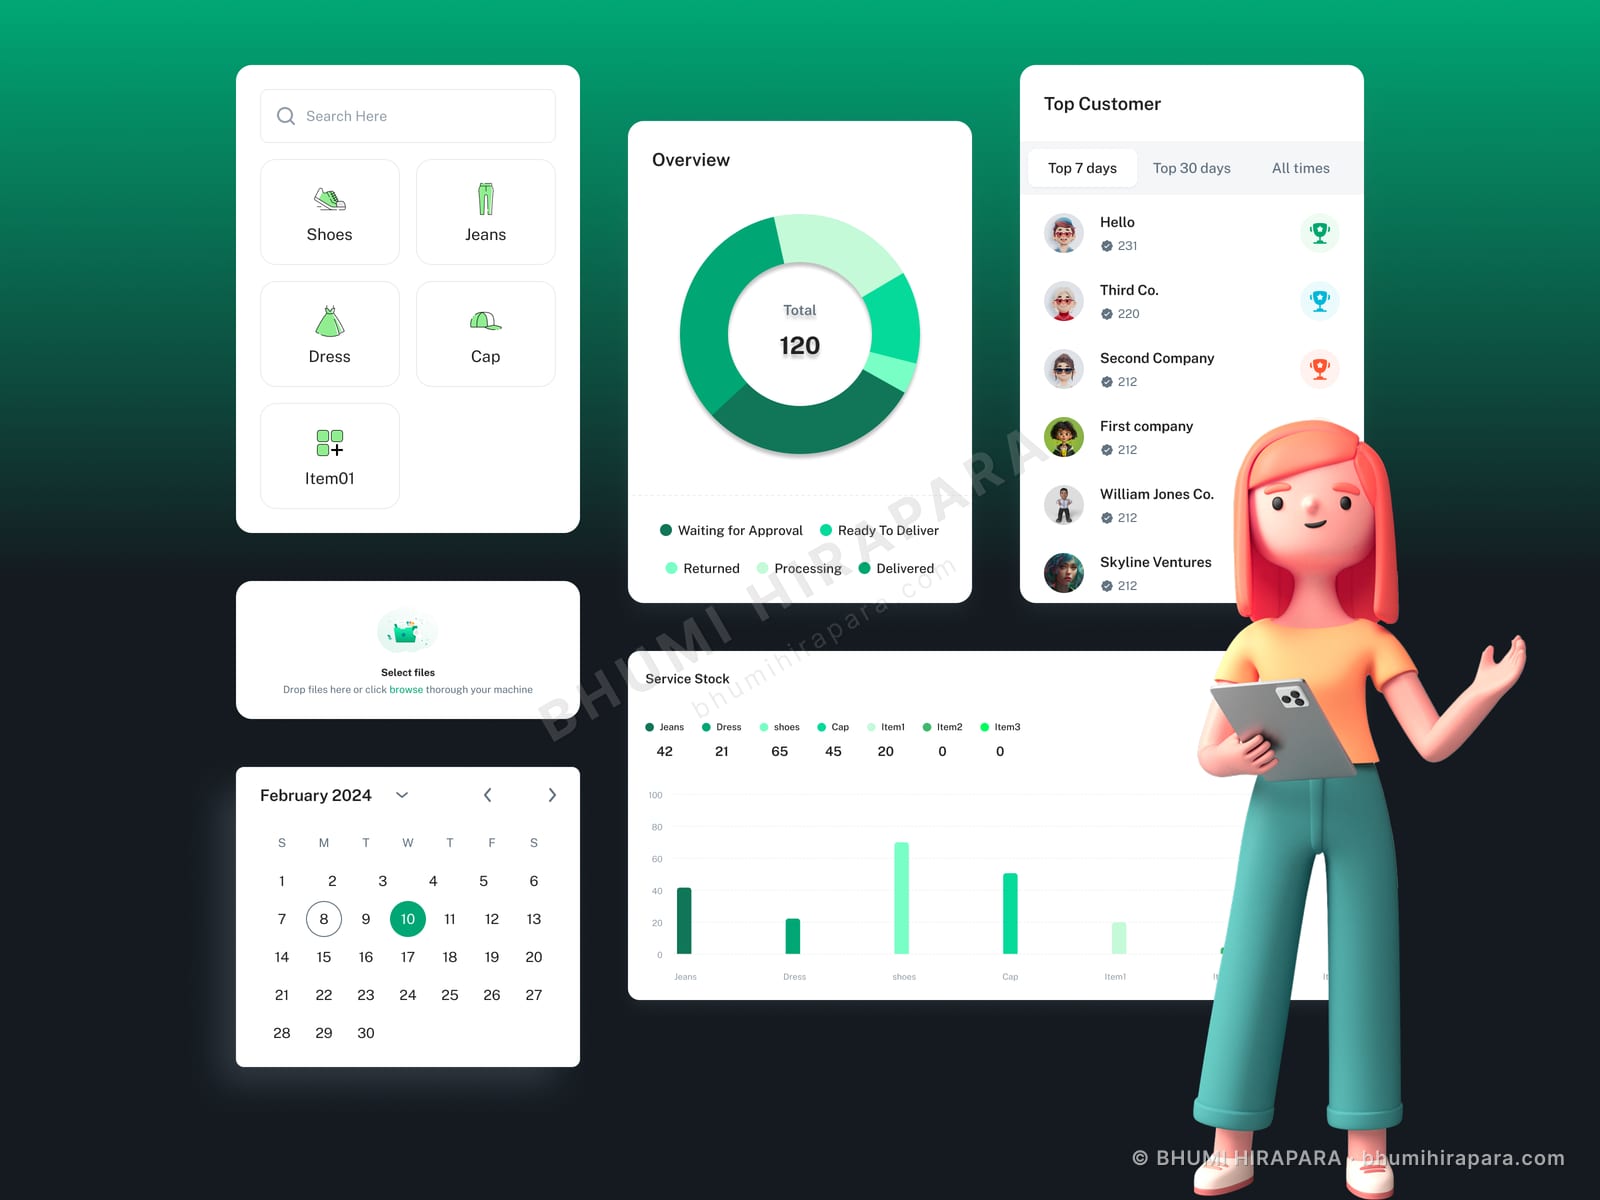
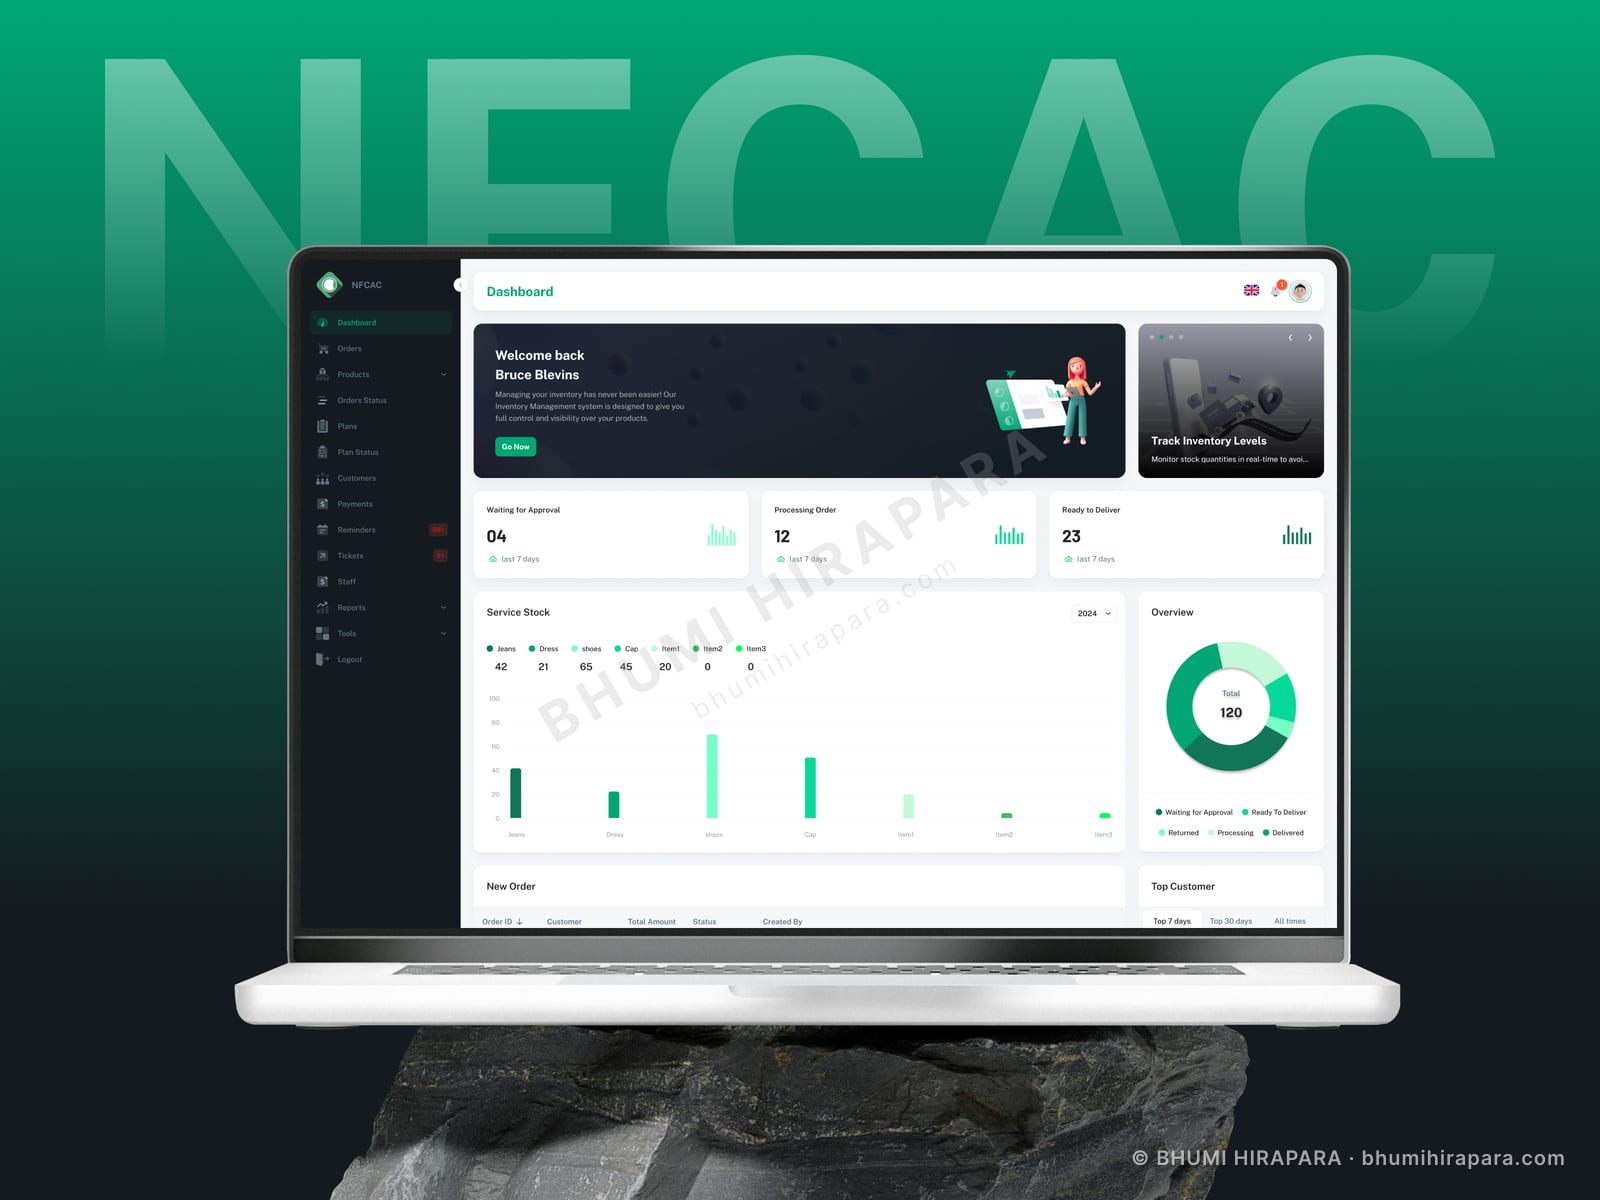
I designed the top of the dashboard as the pipeline itself - waiting for approval, processing, ready to deliver - each with a count and a seven-day trend, so a bottleneck is visible as a shape rather than needing to be calculated. Below it, service stock is shown as a grouped bar chart by status, with a fulfilment donut and a top-customer table alongside. A welcome panel carries the primary action for new staff.
The outcome
A pipeline-shaped dashboard where bottlenecks are visible at a glance, replacing three separate list screens with one operational view.
Shape the dashboard like the process
When the underlying work is a sequence, laying the interface out in that sequence means staff read the screen the way they think about the job. Approval, then processing, then ready to deliver.
Presented as three unrelated tiles, the same numbers require the reader to reconstruct the pipeline mentally every time. Presented in order with trends, a backlog in the middle stage is obvious without anyone doing arithmetic.
Trend lines beat bigger numbers
A count tells you the state. A seven-day sparkline tells you whether that state is building or clearing, which is the thing that actually determines whether anyone needs to act today.
They cost very little space and they change the stat row from a report into an early warning system.
Stock by status, not just by volume
Total stock is a number that feels informative and rarely is. Stock split by status - in, delivered, cancelled, ready - answers the operational question instead.
Grouping the bar chart that way means a category with healthy volume but poor fulfilment is immediately visible, where a single total would hide it completely.